
Index Returns
You have heard the saying that “Stocks climb a wall of worry”. That has certainly been the case so far in the first quarter of 2023. With the Federal Reserve still raising rates, the continuing Russia-Ukraine war, the debt-ceiling concern in Washington, and potential for a recession this year, stocks have fared quite well in the first three months. The S&P 500 is up 7.5% while Mid-Cap stocks are up 4.06%. Small-Cap stocks had a rough March but are still up 2.74% on the year.
International stocks are continuing to perform well and are enhancing portfolio returns. The MSCI EAFE Index is up 8.47% on the year led by France, Germany and Spain which are all up around 15%. The MSCI Emerging Markets Index is up 3.96% on the year led by Mexico’s 20% increase.
Bonds rebounded in March with the Barclay’s Aggregate Bond Index increasing 2.54% to bring the year-to-date return to 2.96%. Global Bonds are also doing well with a 1.91% return in the first three months.
Economic Review and Outlook
The Federal Reserve has been raising short-term interest rates to cool domestic inflation. Their efforts are clearly working as Headline CPI peaked in June of 2022 at 8.9%. This has declined every month since, with the most recent reading of 5.0% in March. With inflation cooling, it is possible that the Federal Reserve pauses the rate hike cycle after their next meeting. This would be a relief for many investors and consumers who are battling the impact of higher rates with wages not growing as quickly.
Gross Domestic Product was positive in the second half of 2022. First quarter estimates for GDP growth are in the 2-3% range. Consumer spending has been resilient, but business spending is starting to wane. We could see overall output decline in the second half of this year. If this occurs and the economy slips into a recession, it is important to remember that recessions only last about 10 months while expansions last about 6 years.
The Leading Economic Index declined 0.3% in February to 110.0 following a 0.3% decline in January. Industrial Production was unchanged in February and manufacturing output edged up by 0.1%. The Capacity Utilization rate (which measures how much slack is in the economy) was also unchanged in February.
Non-farm payrolls rose by 236,000 in March and the unemployment rate remained at 3.5%. Weekly unemployment claims were 228,000 for the week ending April 1, 2023. This was a decrease of 18,000 from the previous week and the 4-week moving average is at 237,750. There are still 10.8 million job openings in the U.S. Job layoffs are starting to move higher, but the overall level is still historically low. It is important to remember that the labor market is a lagging indicator and typically peaks well after a recession has ended.
Manufacturing decreased to 46.3% on the ISM PMI index in March. This was a drop of 1.4% from February. This index has now been in contraction territory for five straight months. The New Orders Index came in at 44.3% which was down 2.7% from the prior month. The ISM Services index was at 51.2% in March. This was 3.9% lower than February but still represents expansion. The Business Activity Index came in at 55.4% which was a 0.9% decrease from February. New Orders for the service sector came in at 52.2%. This was a drop of 10.4 percentage points from February but is still in expansion territory.
The JPM Global Manufacturing PMI was at 52.9 in March which is 0.8 percentage points higher than February. The Euro area is showing strength with a reading of 54.1 led by France at 54.0 and Spain at 55.7. Emerging Economies are also rebounding with a reading of 53.9 lead by India at 59.0.
Equity and Bond Markets
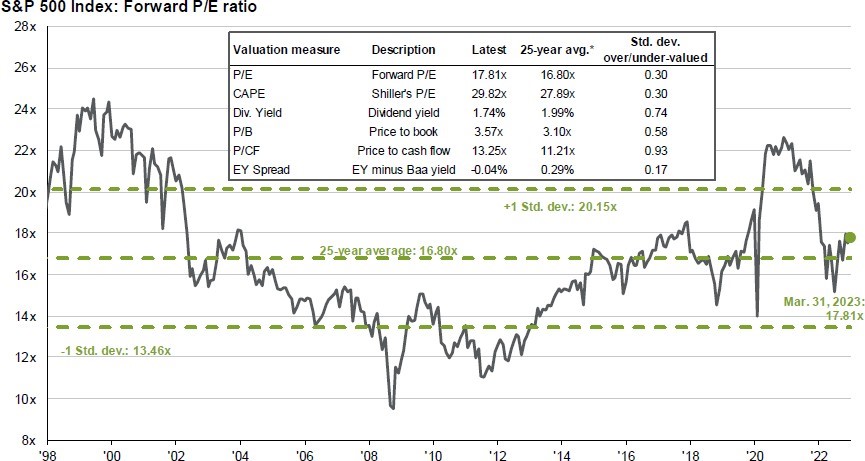
As discussed earlier, stocks had a very difficult year in 2022 as inflation heated up to nearly 9%. The good news for 2023 is that equities are still quite a bit cheaper than they were at the beginning of 2022. In fact, heading into last year, the forward P/E ratio for the S&P 500 was around 22 times earnings. At the end of March, the P/E ratio has dropped to 17 times earnings, which is just slightly above the long-term average.


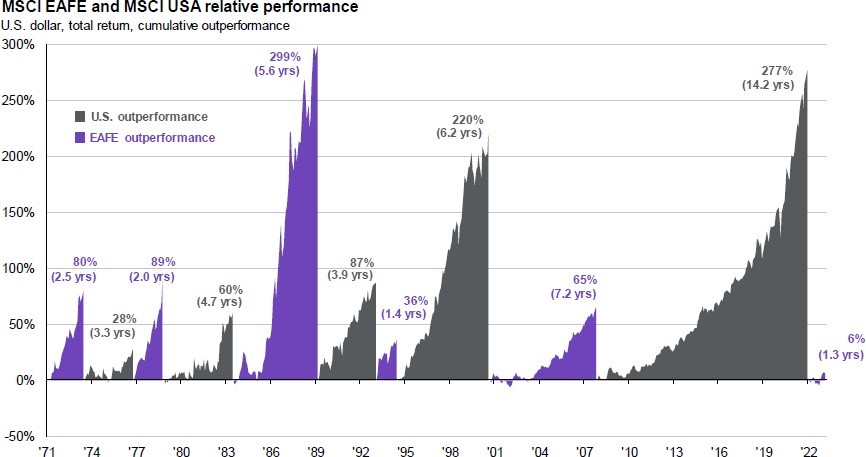
We have been saying for a while that international equities are cheap and look attractive at current valuations. Their P/E ratios are lower, and their dividend yields are higher. U.S. equities have outperformed international stocks since 2008. We believe that we are entering into a new cycle where international stocks will outperform over the next few years. This shift began in October of last year and has continued into the new year.
There are still headwinds for stocks. The Russia-Ukraine war is still putting pressure on supply chains in Europe. We have a looming debt-ceiling crisis in Washington. The Federal Reserve seems very determined to overshoot on their rate hikes to bring down inflation, which will probably throw us into a recession and put pressure on earnings. Just remember, stocks climb a wall of worry and there seems to be plenty of that going around.
The forward-looking return projections for a diversified portfolio have improved dramatically. Bonds look a lot more attractive at these levels and should provide a good boost to portfolios over the next few years.
Portfolio Management
The Investment Committee has maintained our long-term strategy for managing our portfolios. While our overweight in international equities the last couple of years was a drag on the portfolio, it is paying off so far in 2023. We are pleased with the overall performance of the portfolio and have only made minor changes to some funds while keeping the broad asset allocation in line with our historical standards.
Our fixed income allocation is also performing quite well so far this year. We are adding duration to our bonds as we believe that the Federal Reserve is close to pausing their rate hike cycle. If this happens, we could continue to see relatively strong returns from the fixed income side of the portfolio.
We design our portfolios to have an asset allocation strategy that provides optimal diversification and performance. Over a short time-horizon, this type of diversified portfolio can decline in value. However, if we keep a long-term perspective and ignore short-term volatility, the probability of achieving our desired returns significantly increases. Remember, “Time in the Market” is more important than “Timing the Market”.
Financial Planning
FDIC Insurance became a hot topic in the first quarter of 2023 due to the fall of Silicon Valley Bank and a few other smaller banks. For most individuals, it is wise to keep less than the FDIC insurance amount at any one banking institution.
The standard FDIC insurance amount is $250,000 per depositor. Joint accounts are covered up to $500,000. If you need to hold balances above those standard amounts, you can receive additional insurance protection by adding beneficiaries to your account. (Note: When you add a beneficiary to any account, you should set a reminder to review those designations every few years to ensure those beneficiaries still match your wishes. It is easy to forget you’ve added these beneficiaries when making an update to your estate plan)
The FDIC website has an online estimator to see how much of your deposit is covered by this insurance: https://edie.fdic.gov. However, if you have questions on your deposits, it is best to contact your bank directly
If you bank with a credit union, their deposits are backed by the National Credit Union Administration (NCUA). The same insurance limits typically apply.
FDIC and NCUA Insurance only apply to cash at banks and credit unions. Custodians or brokerage firms, such as Charles Schwab, Fidelity, Vanguard, etc. also have insurance to protect client securities.
The Securities Investor Protection Corporation (SIPC) provides protection for securities and cash in brokerage/investment accounts. SIPC is activated if a custodian or brokerage firm files bankruptcy and client securities are missing. The standard amount of protection is $500,000 for securities and $250,000 for cash.
However most custodians have excess protections on top of that standard amount. Charles Schwab’s excess coverage is up to an aggregate of $600 million, limited to $150 million per customer.
It is important to note that SIPC does not protect against a market loss, it only guarantees that securities will not be missing from client accounts. For example, let’s assume an account owner has 10 shares of XYZ stock. The custodian holding those shares for the client files bankruptcy and suddenly the 10 shares of XYZ are not showing in the client’s account. SIPC guarantees that the 10 shares of XYZ will be recovered and placed back into the account. If during that time the XYZ stock goes from trading at $10 per share to $5 per share, SIPC does not reimburse for that loss. It replaces the shares but does not protect against an investment loss.
We know recent headlines can invoke fear in our financial system. We hope shedding light on the protections in place help to minimize concerns.
Company News
2023 marks Galecki Financial Management’s 33rd year in business. We thank all our clients for their trust and confidence over the years.
To celebrate our 30th year in business a few years back, we lowered the cost of our Initial Financial Overview (IFO) from $775 to $300. We decided to keep that rate at $300 indefinitely to provide this service to any prospective client looking for unbiased and sound financial advice.
Our Initial Financial Overview is designed to be an overview of an individual or family’s current financial situation with projections into the future based on certain assumptions. The IFO can cover retirement planning, education funding, insurance needs, tax planning, investment allocation analysis, or any other pertinent financial topic.
If you or anyone you know is interested in our Initial Financial Overview, we’d love to help create a financial roadmap for them to reach their financial goals.
Visit our website to learn more: www.galecki.com/our-services


