
Index Returns
It was definitely a mixed bag in the second quarter for equity returns. The S&P 500 saw an increase of 4.28% powered by the strong performance in mega cap companies. The rest of the equity market was mostly negative. The Russell Midcap Index declined 3.55% in the quarter while the small caps as measured by the Russell 2000 Index dropped 3.28%. Even the Dow Jones Industrial Average saw a drop of 1.27%.
Developed International stocks were mostly flat in the second quarter with a small decline of 0.42%. France was down roughly 7% in the three-month period. Emerging markets showed some strength as the Index advanced 5.0% in the second quarter. This was fueled by India’s advance of 10%. Commodities had a slow second
quarter but are still up more than 11% on the year. Real Estate declined 1.73% in the quarter.
Bonds were very quiet in the second quarter as the market is watching the Fed closely. The Barclays Aggregate Bond index advanced 0.07% in the quarter. Global bonds were also quiet but are still up 2.13% on the year.
Economic Review and Outlook
Economic growth is slowing in 2024. Consumer spending is struggling relative to last year. Although manufacturing is improving, it is not enough to offset the consumer that is feeling the pinch of lower earnings growth and higher cost of goods. GDP advanced by an annualized rate of 1.4% in the first quarter of this year. We expect a comparable number in the second quarter as some data is looking softer.
Inflation is relatively under control. Right now, we are hovering around 3.3%. The cost of shelter continues to be the biggest reason that the number is not lower. However, this is a lagging indicator and will continue to decline over time. The other big contributor to the inflation data has been auto insurance. This is also likely to subside over the next six months. Therefore, we think the inflation data will slowly improve over the remainder of the year.
The Leading Economic Index declined 0.5% in May to 101.2 following a 0.6% decline in April. Industrial Production increased 0.9% in May. The Capacity Utilization rate (which measures how much slack is in the economy) moved up to 78.7% which is in line with it’s long-term average.
Non-farm payrolls rose by 206,000 in June and the unemployment rate ticked up to 4.1%. Weekly unemployment claims were 238,000 for the week ending June 29, 2024. The 4-week moving average is at 238,500. There are 8 million job openings in the U.S. which is down from 10.1 million in June. It is important to remember that the unemployment rate is a lagging indicator. Weekly unemployment claims is a better real-time indicator and this number has been rising. We are beginning to see some softening in the labor market. The unemployment rate is now 0.7 percentage points higher than the low of 3.4 last year. We have never seen an increase of 0.6 or more and not been in a recession. This story will be an interesting one as the year progresses.
Manufacturing registered 48.5% on the ISM PMI index in June. This was a decline of 0.2% percentage points from May and has now been in contraction territory for 19 out of the last 20 months. The New Orders Index came in at 49.3% which was 3.9 percentage points higher than May. The ISM Services index was at 48.8% in June and has now been in contraction for two of the last three months. The Business Activity Index came in at 46.9% which was 11.6 percentage points lower than May. New Orders for the service sector came in at 47.3% which was 6.8 percentage points lower than May and the first contraction reading since December of 2022. The Employment index was at 46.1% and has contracted for six out of the last seven months.
The JPM Global Manufacturing PMI was at 53.1 in June down slightly from the 53.7 mark in May. The Euro area is at 50.8 while Emerging Economies are growing at 54.4.
Equity and Bond Markets
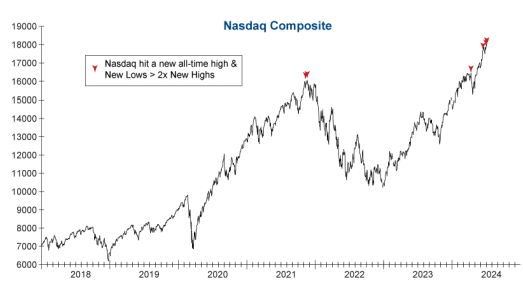
Equity markets have continued their push higher with domestic large-cap growth stocks leading the way. The top ten stocks in the S&P 500 now make up 37% of the market cap weighting and are carrying a P/E ratio of more than 30 times earnings. The Nasdaq Composite index, for the first time in history, saw the number of stocks hitting new 52-week lows outnumber those hitting 52-week highs by 3-to-1 on the same day that the index hit an all-time high. This has happened three times now in the last few weeks. There are only two other occasions where we saw a 2-1 downside ratio with a new high. One was on April 11, 2024, and the first was in November of 2021. This was followed by a 36% loss in the index. This could be an early warning flag for the Nasdaq index.

The Magnificent 7 now have a market cap weighting that is larger than all of China’s market. In fact, it is roughly equivalent to Japan, India, and France combined. Value stocks historically tend to outperform growth stocks in higher interest rate environments. The P/E ratio for value stocks is roughly equal to their long-term average which means they are relatively attractive at these levels.
Stocks outside of the U.S. continue to look attractive at these levels as many are trading at or below their longterm average P/E ratios. While the U.S. market now represents 64% of the global market cap weighting, it is important to remember that we only produce about 25% of the global GDP annually. This means there is a lot of economic activity occurring outside of our borders which is not being fully reflected in market cap weightings.
We have a major election in November. This election has become quite polarizing. It is important to remember that these election outcomes have historically had little impact on long-term investing fundamentals and [Type here] [Type here] [Type here] Third Quarter 2024 performance. We believe that you should build a diversified portfolio and keep a long-term focus. Worrying about politics in Washington typically does not help an individual’s portfolio performance in any way.
The bond market is now expecting one rate cut this year. As discussed earlier, consumer demand is softening, and the labor market is cooling. Housing is also showing signs of weakness. We do think it is likely that we see one cut later this year followed by 3-4 cuts in 2025. This reduction in short-term rates should help the bond side of
the portfolio over the next 18 months.
Portfolio Management
The Investment Committee continues to monitor the economy, the market, and the allocations. The economy is still growing, but the pace of growth is indeed slowing. Consumers are starting to spend less as their expenses on essential items such as food and housing has reached a critical level. This means that discretionary spending on items like home improvement and travel and leisure could see declines in the second half of this year.
We are watching our allocation closely and are in constant communication, especially to assess the overall risk of our growth exposure. We believe that value stocks will begin to outperform growth stocks over the next few years. We also think that international equities should provide a boost to the portfolio, especially if the U.S. Dollar begins to decline, which we think is likely.
It is important to keep a long-term focus and ignore short-term volatility. This is a presidential election year, and we could see some volatility as Election Day approaches. Once the election is over and that uncertainty is removed, we should hopefully start to see volatility subside.
Any changes that we do make will be tactical in nature as we will not try to “time the market”. We are long-term investors and will do our best to ignore the short-term volatility we could see over the next six months.
Financial Planning
Donor Advised Funds (DAFs) have increased in popularity as a way for individuals and families to fund their philanthropic goals. According to the 2024 National Study on Donor Advised Funds by the Dorothy A. Johnson Center for Philanthropy, 81% of DAFs in their study were opened after 2010 and over 25% were opened after 2020. Individuals and families are the owners of approximately 97% of DAFs in existence. DAFs are becoming an intriguing way to earmark funds for charity without incurring high fees or introducing unnecessary complexity to a financial plan.
A Donor Advised Fund is almost exactly as it sounds. It is a charitable fund that is set-up and funded by a donor: an individual, couple, family, etc. DAF contributions count as a charitable gift in the calendar year they are given, even if the funds aren’t distributed to an actual charitable organization in that year. The DAF holds and can invest the funds per the donor’s instruction and distributed later. The donor grants funds from the DAF to 501(c)3 charities of their choice at any time in the future.
DAFs are funded for many reasons. Over the past few years, we have seen them funded most often for two reasons: a taxpayer has a taxable event (such as selling a business) causing a heavy tax year or a taxpayer decides to “lump” multiple years of charitable giving together to itemize tax deductions.
Cash, appreciated securities, and even appreciated real estate or tangible property (such as artwork) can be used to fund a DAF. For more complex giving, it is best to work directly with the custodian of the DAF to ensure all rules are followed.
DAFs can be custodied at a variety of providers. Schwab, Fidelity, and Vanguard all have DAF divisions. Each [Type here] [Type here] [Type here] custodian has a variety of different account minimums and administration and investment fees. We are most familiar with Schwab, so as an example, they have no account minimums and charge 0.60% on the first $500,000 of assets. For a $50,000 DAF, this would be an administration fee of $300 annually. Additional investment fees will apply depending on what funds are used.
Most local community foundations also provide DAFs. If a donor wants to meet a specific need in their local community, community foundations are typically better equipped than the national providers to work to find solution to the donor’s wishes.
DAFs are beginning to take the place of private foundations. In the past, private foundations were one of the only ways for donors to ensure their funds were earmarked for charitable causes without giving the funds immediately. However, private foundations have many rules and regulations that must be followed very closely. The ongoing maintenance costs and added complexity of private foundations typically deters donors.
Donor Advised Funds also allow for succession planning. You can name successor owners of DAFs to carry out charitable giving after the original donor(s) death. You can also name charitable organizations outright to receive funds.
For individuals and families who are charitably inclined, it may be worth exploring if a Donor Advised Fund could play any role in your financial plan.
Company News
Earlier this year, Andy Young was honored as one of Greater Fort Wayne Business Weekly’s Forty under 40. This award recognizes the top professionals in business in all of Northeast Indiana.
With over 10 years of experience in wealth management, Andy’s dedication and expertise earned him this welldeserved honor. Andy’s commitment to helping individuals and families achieve their financial goals has never wavered. We are proud of Andy for achieving this honor!

The full list of this year’s honorees can be found at: https://www.kpceventbuzz.com/forty-under-40/
