

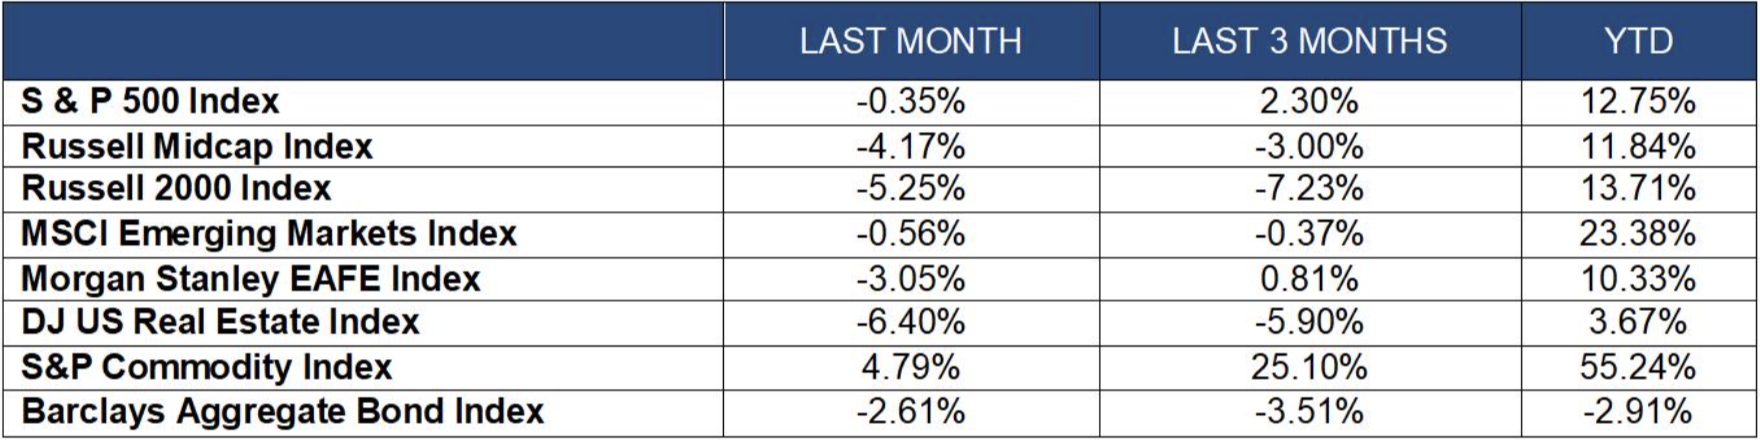
Index Returns
The markets were mixed in the third quarter as investors were contemplating the Middle East impact and surging earnings growth throughout the globe. The S&P 500 was positive by 2.3%, in the quarter, but mid-cap and small-cap stocks were negative.
International stocks were flat over the last three months but are still outpacing domestic stocks on the year. Gold rose by 4% in the quarter while silver was unchanged. Bitcoin and other crypto currencies were up sharply over the last three months and are now near where they began the year. International stocks continue to offer diversification benefits. While the third quarter was quiet for international equities, 2026 returns remain solid. Japan and Singapore are up roughly 23% on the year while Taiwan is up 70%, and Korea is up nearly 90%. Sales of semiconductors continue to flourish.
Bonds had a rough quarter, but their selloff may be overdone. The Barclays Aggregate Bond Index is down roughly 3% on the year. The global bond market is now down nearly 2% in 2026. The Federal Reserve increased rates by 25 basis points in the quarter and indicated that they may hike again in December. However, the market believes they may hike 3 more times in 2027. If this is overstated, then bonds may do just fine next year.
Economic Review and Outlook
After a decent 2.2% growth rate in the second quarter of the year, economic activity appears to have picked up in the third quarter. Discretionary spending has remained strong and business inventories have picked up as we head into the holiday season. Third quarter GDP growth is estimated to be between 2.5% and 3.0%.
The labor market continues to show resilience. Nonfarm payrolls added 162K jobs in August, and the 3-month average is around 71K. The unemployment rate is around 4.1%, which is historically quite low. With the Baby Boomers leaving the work force, a declining domestic population and very little immigration, we might be entering a worker shortage environment very soon. Wage growth, however, is averaging only 3.3% which means that households are not keeping up with inflation.
The inflation situation continues to improve, but at a very slow pace. Headline CPI rose 3.4% in August, which is down from 4.2% earlier this year. Energy continues to be a major contributor to this number. If energy prices ease over the next year due to improvement in the Middle East, then we could see the CPI slowly get back to the 2.5% level.
The Leading Economic Index decreased by 0.1% in August following a 0.2% increase in July. Industrial Production increased 0.7% in September after rising 0.1% in August. The Capacity Utilization Rate (which measures how much slack is in the economy) was at 76.9% in September, which is still below the long-term average.
The K-Shaped economy continues to be discussed in economic circles. Individuals in the top 20% by net worth continue to see their net worth grow in this environment, while those in the bottom 20% are having a more difficult time keeping up with higher costs. For example, low-income households spend about 10-18% of their total income on gasoline, while high-income households spend roughly 2% of their income on gas.
Manufacturing registered 54.5% on the ISM PMI Index in September. This indicator remains in expansion territory for the 23rd month in a row. The New Orders Index came in at 55.3%, which marks the ninth month in a row of growth. The ISM Services Index was at 54.9% in September, which was down 0.5% from August. The Business Activity Index came in at 56.5%, which dropped from 60.9% in August. New Orders for the service sector came in at 59.8%, which was 1.1 percentage points below the August reading of 60.9%.
Business spending on Artificial Intelligence has been booming in the last few years, and this is expected to continue through 2028. Worldwide spending is expected to reach $2.7 trillion this year, which is a roughly 47% increase from last year. Microsoft, Alphabet (Google), Meta, and Amazon will account for $760 billion in 2026. Most of this expenditure is on infrastructure spending. The question that has yet to be fully answered is what this will do for profits over the next ten years.
Equity and Bond Markets
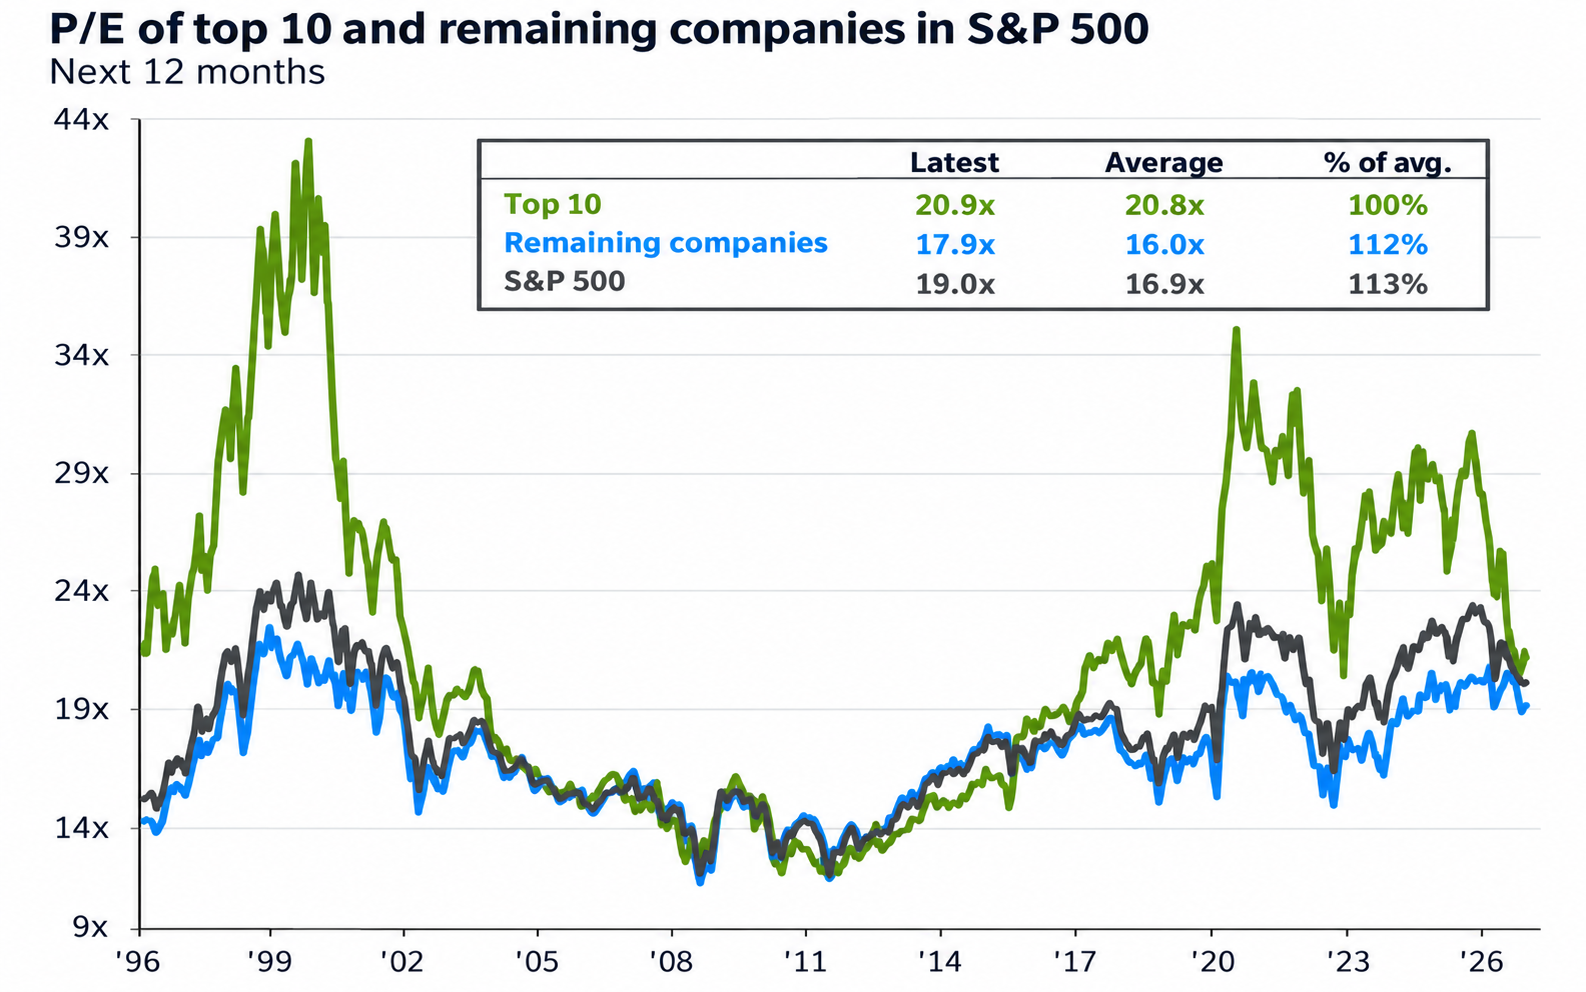
Equity markets have had an impressive run so far in 2026 and over the last three years. While the S&P 500 has advanced by double digits this year, the P/E ratio has declined since the beginning of the year. Prices have indeed moved higher, but earnings have improved faster than underlying stock prices. The P/E ratio for the top 10 stocks fell from 29 times earnings to roughly 20 times earnings. Overall, the S&P 500 is now trading at 18 times earnings, which is only slightly higher than the long-term average of 16.0.
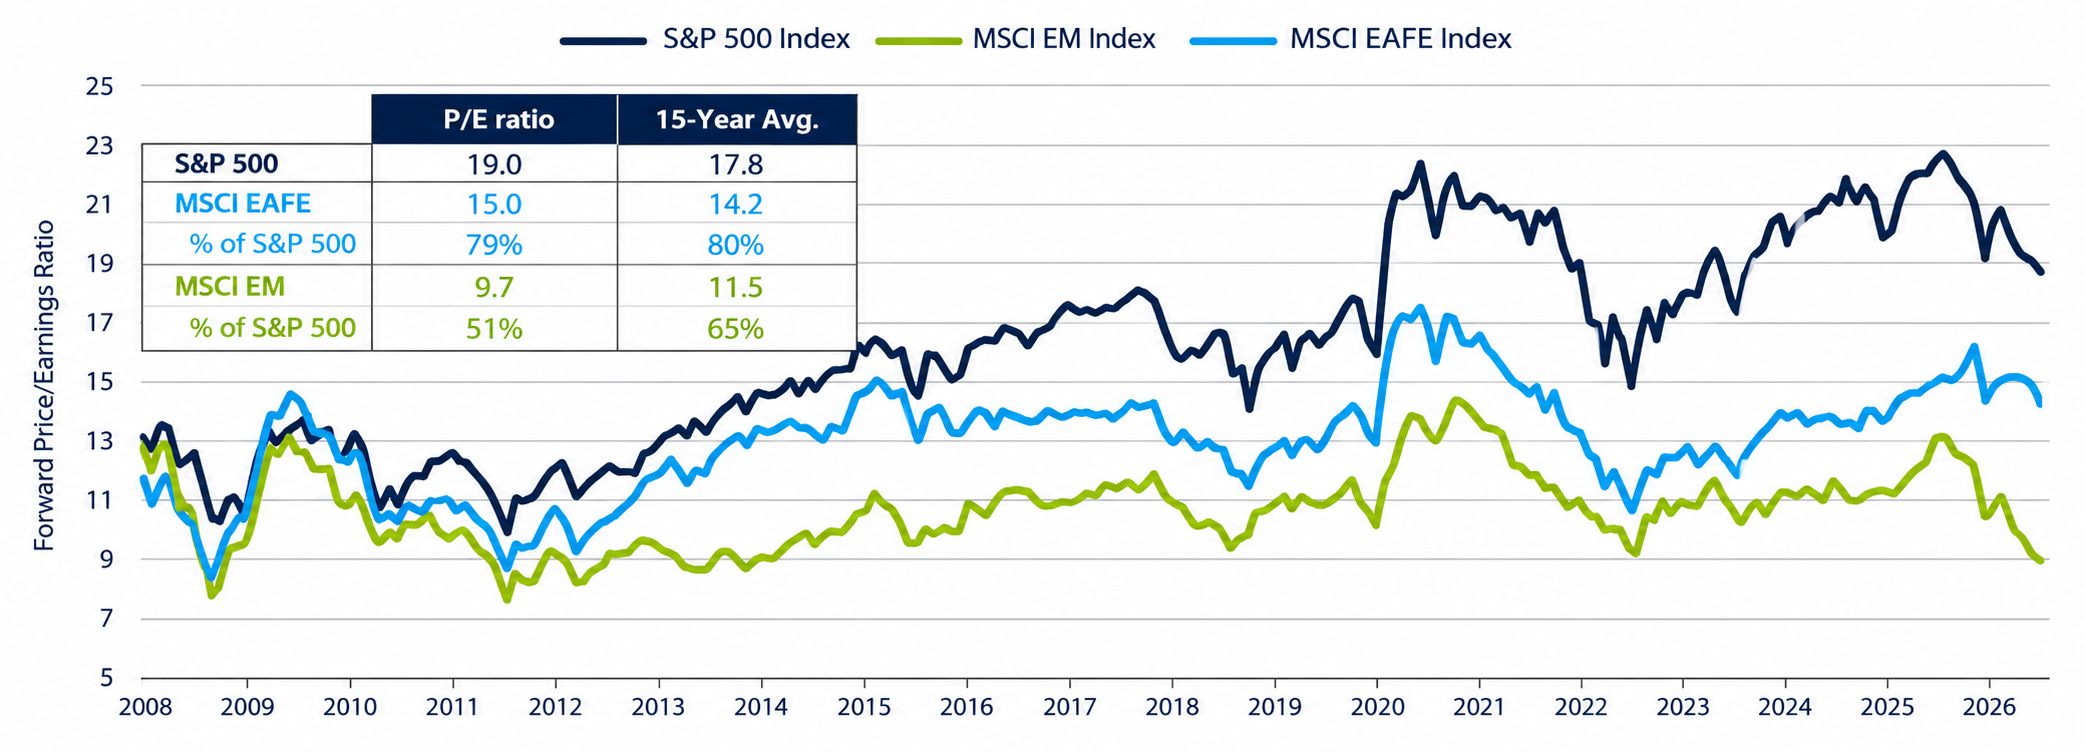
Domestic stock performance is still being led by growth stocks. Growth outperformed value for both large-cap companies and mid-cap companies. Only the small-cap index showed performance that was equal across growth and value. Meanwhile, International Equity Performance continues to be the big story. Emerging markets are now up roughly 23% on the year and continue to look attractive relative to their long-term valuations.
Currency changes can impact international returns. A stronger dollar will detract from international returns while a weaker dollar will increase the number. So far this year, the U.S. Dollar has posted a 4% gain. Most economists believe that the dollar will fall over the next few years, which should add an additional tailwind for international equities and foreign bonds.
The bond market was given a bit of a shock when the Federal Reserve raised short-term rates last month by 25 basis points. The reasoning for the hike was an attempt to cool inflation and bring it back down under 3%. The market believes that the Fed will raise rates in December and maybe 2-3 times in 2027. If the market is overestimating these moves, then bonds may fare better than anticipated next year.
Portfolio Management
The Investment Committee continues to monitor the economy, the market, and the portfolio allocations. Our strategy has not changed. We expect continued volatility in the market as we approach the mid-term elections in November. Uncertainty in the political environment can increase short-term volatility in equities. However, we do not recommend making big changes in allocations because of Washington.
We will continue to look at ways to diversify the portfolio to try to minimize the downside capture ratio. We are looking at ways to increase the yield of the portfolio while maintaining appropriate risk. It will be important to have an allocation discussion with your planner to make sure that your current allocation matches your investment risk and time horizon.
Earnings expectations have continued to move higher, which has compressed valuations as discussed previously. This earnings strength should support stocks sufficiently if we only see 1-2 rate hikes. The pace and magnitude of the hikes is what matters, with big moves having the potential to rattle investors. At this time we continue to be bullish about stocks over the next 5-10 years.
Financial Planning
The fourth quarter is the Medicare Open Enrollment Period. Open Enrollment begins on October 15th and ends on December 7th. During this time, you can change to a different Medicare Supplement plan, Medicare Advantage plan, or a Medicare Drug plan. If you haven’t reviewed your Medicare coverages in a few years, we recommend reaching out to your trusted Medicare insurance advisor to ensure your plan still best meets your needs.
With Medicare Open Enrollment underway, it is a good time to review your coverage. Please note at the time of this writing, Medicare has not released the new premium and deductible numbers for 2027. We are using 2026 figures.
Medicare is a federal health insurance program for individuals 65 years of age or older and those with disabilities. Although it is not intended to cover everything, it is vital in helping to pay for healthcare expenses in retirement.
Medicare Parts:
- Part A – This covers hospital services. The annual deductible is $1,736. The monthly premium is $0 if you or your spouse has 40 or more quarters of qualified employment.
- Part B – This covers doctor visits and other outpatient services. The annual deductible is $283. Part B has a base monthly premium ($202.90), and an Income Related Monthly Adjustment Amount (IRMAA) is added to the premium if income is over a certain threshold based on your income filing status.
- Part D – An optional add-on that covers drug expenses. Part D plans are sold by private insurance companies. Part D also has an IRMAA premium adjustment.
Individuals can also pick a Medicare Supplement Plan (also called Medigap) or a Medicare Advantage plan. Both types of plans are also sold by private insurance companies.
Medicare Supplement plans help with expenses like copayments, coinsurance, and deductibles. Certain treatments not covered by Part A or Part B are also covered by some supplement policies. These plans are usually referred to by letters ranging from Plan G to Plan N.
Medicare Advantage plans, also known as Part C, are an alternative to Original Medicare. Advantage Plans “bundle” Medicare Part A and Part B coverage and can include Part D coverage as well as other benefits such as hearing, dental, and vision coverage. Some companies offer zero premiums for the Advantage Plan (you will still need to pay the Part B premium – and the IRMAA if it applies). You usually must see an in-network provider and can be subject to prior authorization rules or be required to receive a referral to see a specialist.
Choosing the right Medicare path is dependent on many different factors. We recommend working with a trusted Medicare insurance provider to evaluate needs.
Company News
We work hard to create a welcoming, collaborative, and engaging environment at Galecki. Throughout the year we carve out time for team-building events with our staff. This summer, we took a tour through downtown Fort Wayne on a trolley bike through a local business called Pedal City. Of course, we picked the hottest day of the year, which happened to be in early September. Despite the heat, we all had a great time.

We also hopped off to explore the Fort Wayne Public Art Trail. We only saw a portion of the amazing murals, sculptures, and other pieces of art that Fort Wayne has to offer. If you are interested in the Art Trail, the city offers a free digital pass with a map to all the featured pieces. https://www.visitfortwayne.com/publicarttrail/.
If you would like to schedule an appointment with a CERTIFIED FINANCIAL PLANNER® Professional, please visit galecki.com